Driving down leakage
REMOTE LOGGING, through GSM and GPRS devices in particular, is commonplace and easily accessible to all water suppliers in virtually every country. The costs associated with both the hardware and the software, as well as associated communication charges, have all decreased in recent years with the result that the financial viability of using such technology to assist with leakage reduction activities is now clearly evident. This article will provide a brief over view of the use of flow and pressure loggers in a water reticulation system to highlight the value of such information as part of any leak- age reduction programme. The interpretation of minimum night flows (MNF) and various pressure checks will be discussed using a number of practical examples to demonstrate how such logging results can be analysed. It will also present details and interesting examples from a wide variety of case studies under taken throughout Southern Africa using some of the latest internet-based data acquisition and display systems. Such technology is now widely available to virtually every water supplier in the world and the benefits of proper monitoring and rapid response to problems is without doubt one of the most effective measures in driving down leakage. The remainder of this article will explain some of the key issues associated with both flow and pressure logging and provide some examples to highlight the value of such logging.
Importance of logging
Managing a water reticulation system is a difficult and often confusing job in which problems continually occur due to either burst pipes or some operational problem usually associated with opening or closing of valves or equipment failure. Identifying the source of the problem is often a problem in itself and one of the most useful tools in addressing such problems is the analysis of logging data. Logging involves recording pressures and/or flows entering a zone and can be compared to a doctor recording the blood pressure and heart rate in order to determine the health of a patient. From a management viewpoint, the logging results often highlight problems within the water supply system, which can then be addressed. Without regular logging results and associated analyses, such problems can exist unnoticed for months if not years and result in higher leakage and/or poor service delivery. Logging of pressures and flows is one of the most important aspects of any water demand management (WDM) programme and one that is generally neglected if not ignored completely. In recent years, with the advent of GSM and GPRS based loggers, it is now possible to capture and transmit logging information with relative ease. Such information, if used properly, can help water managers to man age their water distribution systems effectively and efficiently and they can often identify problems before they become major crises. There is no substitute for reliable “real-time” flow and pressure information and, where available, it will facilitate the analysis of MNF, which was the original foundation of any proper WDM programme. Over the years, more effort seems to have been placed on high-tech electronic solutions and software, which eliminates the need to visit the site or to get one’s hands dirty. Recording and analysing MNF has, in fact, become less common as the new technology and software models eliminate the need for any such analyses. In reality, many water reticulation managers have lost the ability to properly manage their systems in many parts of South Africa and there is a real need to move back to the basics and start using logging results to monitor the water reticulation systems and to find problems. Reliable logging information provides a manager with real-time data on what is really happening in the system as opposed to what the hydraulic models say should be happening. Having stressed the importance of undertaking regular flow and pressure loggings in a water supply system, it is equally important for the technician or manager receiving the information to understand what it represents. Analysing and interpreting logging results is often very confusing and difficult and can be compared to “detective work”. This article concludes with the interpretation and understanding of logging results and all graphs shown are from real examples collected by the author.
Understanding and interpreting logging results
In order to identify problems within a reticulation system, it is useful to understand the flow and pressure logging results from the system in question. As mentioned previously, this can be compared to detective work in that the problems are not always obvious and sometimes the water supply manager must give each set of logging results some serious consideration. This skill only be developed through practise and, for many people, logging results are confusing and meaningless with little or no value. If the results are explained, however, the person examining a graph of flow and/or pressure will quickly start to appreciate the value of the information. In time, the person examining the graphs will become skilled in identifying problems, some of which can be very subtle and interesting. To demonstrate the value of the logging results, a few real examples are discussed.
Example 1
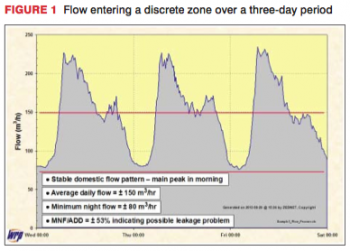
A typical flow logging result for a discrete zone over a three-day period is shown in Figure 1. This very simple and clear-cut example indicates a typical domestic demand pattern that is repeated each day and has a morning and evening peak demand together with a minimum demand sometime during the late evening or normally around 02:00 in the morning. As can be seen from the graph, the MNF is around 80 m3/h with an average daily flow demand of approximately 150 m3/h. One of the most useful benefits of a flow logging is to help identify if the zone has a serious leakage problem. The MNF can be analysed with relative ease using the SANFLOW Model developed through the Water Research Commission (WRC, 1999). This model is freely available and is very easy to use and will provide a realistic estimate of what the MNF should be for a specific zone based on the key characteristics of the zone. The unexplained leakage is basically the difference between the expected MNF and the actual MNF. If the water loss “detective” wishes to get a very rough and ready estimate of whether or not the zone has a leakage problem, they can simply calculate the ratio of the MNF to the average daily demand (ADD). If this ratio is below 20% then there is generally no serious leakage problem and if it is above 20% then there may well be a problem, which should be investigated. In the case of Figure 1, the MNF/ADD is 53%, which clearly indicates that there is a leakage problem.
Example 2
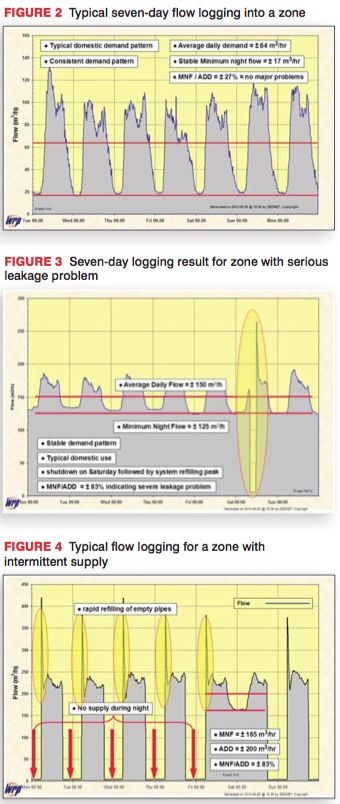
The second example as shown in Figure 2 is a typical flow logging from a discrete zone supplying a residential area. Once again, the typical domestic demand pattern with a morning peak and evening peak can be seen. The MNF is approximately 17 m3/h while the ADD is estimated to be 64 m3/h. The ratio of the MNF to ADD is 27%, which suggests that there may be a small leakage problem; however, in most parts of South Africa this zone would not be considered a high-priority zone for leakage detection and has no major problems.
Example 3
The third example again shows a seven-day logging result for a discrete zone supplying a residential area. In this case, it is clear that there is a very high MNF, which is indicative of high leakage. This is confirmed by the high MNF/ADD ratio of 83% and there is little doubt that this area has massive leakage. This type of graph is typical in many residential areas where payment for water is low and internal plumbing leakage is very high. The graph also shows the impact of a shutdown on the Saturday where the water supply was cut for several hours. Of interest is the sudden sharp increase in water demand immediately after opening the supply into the area. Such spikes in ‘demand’ are caused by the rapid filling of the pipes, which emptied when the water supply was cut. Great care must be taken when opening the water supply into an area after any shutdown, as such spikes can often damage the water meters in cases where a mechanical meter is used.
Example 4
The fourth example shows the logging result into an area of intermittent supply, which is fast becoming a common occurrence in some parts of South Africa and is the norm in most developing countries. Once again the spikes caused by the rapid refilling of the pipes (which can damage the meters) are clearly visible. The issue of air in the pipelines is also a serious problem since it can cause bursts if the air valves are not fully operational. Intermittent supply is a very serious issue and should be prevented if possible. If allowed to continue, the leakage rates in the reticulation system will increase to such an extent that the system will eventually break down completely. In this zone, it was not possible to evaluate the leakage levels due to the intermittent supply that prevented any indication of the MNF. To overcome this problem, the supply was opened for two days so that some estimate of the MNF could be established. As can be seen, the MNF/ADD ration was estimated to be 83%, which suggests extremely high leakage.
Example 5
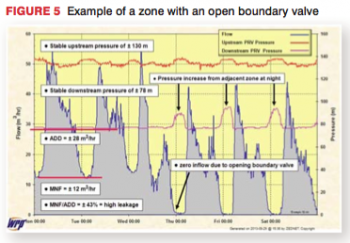
The fifth example, shown in Figure 5, is a more complicated and interesting case in which both pressure and flow are presented for the zone inflow to an area controlled by a pressure-reducing calve (PRV) that was initially thought to be discrete. In this case, it can be seen that after a few days the MNF drops to zero and, at the same time, there is an increase in pressure at the downstream side of the PRV. It should always be remembered that there will always be some level of MNF in a zone and the MNF will never drop to zero, even after rigorous leak detection. If the flow into the zone drops to zero, then it suggests that the MNF is being supplied from another source, which immediately points to some breach in the zone. In this particular case, a boundary valve has been opened, which has little influence during the peak daily demands but during the off-peak demand periods when the inflow to the zone is low, the connection is capable of pushing up the overall zone pressure. When the zone pressure at the downstream side of the PRV increases above the pressure set at the PRV, the valve closes and all flow through the valve stops – hence the zero MNF.
Example 6
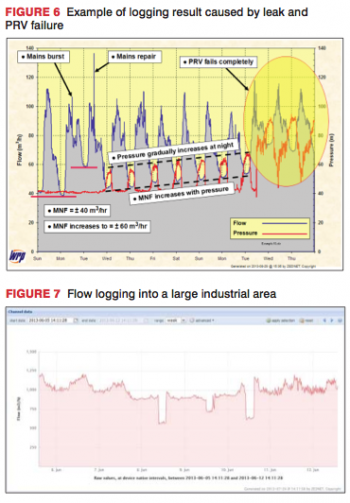
The sixth example is by far the most complicated shown so far and demonstrates a number of interesting issues and clearly highlights the true benefit of monitoring the flows and pressures into an area. Figure 6 shows the flow into a discrete area that is controlled by a PRV. The downstream pressure at the PRV is shown in red. As can be seen, the pressure at the PRV is constant for a few days after which it increases at night much in the same manner as shown previously in Figure 5. In this case, however, the increase in night-time pressure is not due to the opening of some cross-boundary connection, but rather the failure of the PRV to maintain a constant downstream pressure. If the pressure increase was due to an open cross-boundary connection, the PRV would have closed with a subsequent drop in the MNF. In this case, it can be seen that the MNF increases, which is due to the increase in leakage caused by the higher pressure. Basically, this graph from a South African installation in Johannesburg depicts quite a complicated story and has been used in many textbooks around the world to demonstrate the value of logging pressure and flow. The problem starts with a reasonably large mains burst in Day 2, which is evident from the spike in flow (as noted on the graph); this in turn creates a sudden increase in the MNF of about 20 m3/h. An average mains burst would be around 6 m3/h and so this burst is relatively large. The repair takes place on the following day and a spike in flow is evident, which is possibly due to some refilling of empty pipes after the water supply is restored to the area that had been isolated during the repair. It can be seen that the MNF drops back to near pre-burst levels on Day 3. At this point, the PRV star ts to fail for some reason and the failure gradually becomes worse over a period of a week after which it fails completely. The example shown in Figure 6 requires time to fully understand, but is one of the most interesting logging examples found to date. It not only provides a history of the failure of a PRV, but clearly highlights the pressure-leakage relationship of the area where the MNF gradually increases over the seven-day period in response to the gradually increasing night-time pressure.
Live logging
Many logging results are derived from loggers located at or near valve chambers, which are left for a week or two and then downloaded manually by the technician. Such loggers are commonplace in most municipalities and provide much useful information. Unfortunately if a problem does occur, these loggers cannot respond immediately and the problem may only be identified several days later when the logger is downloaded. With the recent developments in logger technology, it is now possible to use real-time loggers that can transmit the data back to some central database on a daily or hourly basis. In addition, such loggers will usually incorporate some form of alarm setting whereby any unusual flow or pressure reading can trigger an alarm that is sent immediately to a predefined location. Transmission of the data can be achieved in a number of ways, including radio-link or the cellphone networks using GSM or GPRS communications. A few more logging results from one such live system are provided to highlight the benefits that can be achieved from such information.
Example 7
The logging result shown in Figure 7 depicts the inflow to a large industrial area. It tells an interesting story and highlights some very serious issues. Firstly, if the first two days of logging are considered, it can be seen that the MNF is around 1 000 m3/h and the ADD is around 1 100 m3/h. While night-time use can be expected in an industrial area, it is highly unlikely for it to be in the order of 90% of the average daily demand. Typically, a value of 30 or 40% would be expected and, in this case, the high MNF is an indication of very serious leakage. Another interesting issue highlighted by the graph concerns the two large drops in flow on 8 and 10 June. The first drop occurred when the supply to a small factory was temporarily cut in order to install a new water meter to the factory. The project team undertaking the meter installation had closed a small section of pipe approximately 100 m in length in order to cut in the new meter and when they checked the flow logging results that evening on the internet, they picked up a drop of almost 350 m3/h going into the area. Initially they thought this must have been an error and they repeated the valve closures again two days later on 10 June and picked up the same result. What this result has identified is a leak of more than 300 m3/h from a very short section of pipe at a cost of over R13 million per annum to the municipality. While it seems implausible that such a large leak could remain undetected for any length of time, it is estimated that it has been running for years! The factory owners on each side of the nearby swamp area were told that the swampy marshland was due to groundwater and has been in existence for many years. This is a nice example highlighting the benefits of real-time flow monitoring and also touches on the concepts of “step-testing” in which small sections of a reticulation system are isolated and the impact on the MNF is monitored. In this case, it was not necessary to look at the MNF as the impact was so significant that it was evident from the normal daily flow.
Example 8
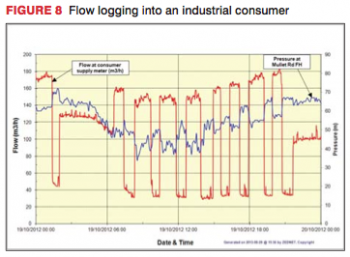
Live logging is not restricted to municipalities and is also very useful to individual consumers, particularly large industrial water users as can be seen from the graph shown in Figure 8. The graph shows the flows being used by a relatively large industry and it is clear that some form of tank is being filled every hour or two. This practice of intermittent filling causes serious pressure fluctuations in the water reticulation system in the vicinity of the industry and was creating problems for the municipality and other nearby industrial users. On presentation of the logging results to the industry in question, they were happy to modify their abstraction process to a more constant rate of abstraction that would not create large pressure fluctuations in the reticulation. Industries are often unaware of the demand pattern they impose on the municipal network and the live logging is of great use and interest to their water managers who generally wish to ensure that they are using water responsibly.
Example 9
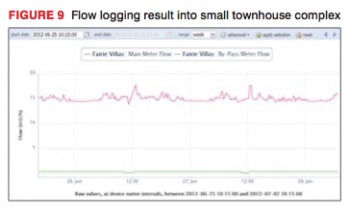
Another interesting example is presented in Figure 9, which shows the flow entering a small complex containing around 50 townhouses. After receiving an unusually high water account for two consecutive months, which was approximately R50 000 higher than normal, the owners realised that it was not a mistake and that they had a leak. A GSM/GPRS logger was installed for a few days and immediately picked up the fact that there was a leak of approximately 14 m3/h within the complex. The leak was repaired and the water use dropped back to normal in the following week. This example highlights the fact that such flow logging is not limited to large users, but can also be very useful to small townhouse developments. The typical cost of such a logger and the annual communication charges is generally between R10 000 and R20 000 per annum, which is often well below the cost of water lost through even a modest leak. Such logging is also very useful in identifying any small leak that is gradually increasing with time as this can easily be picked up by the gradually increasing MNF.
Summary and conclusions
Flow and pressure logging is already an essential element of any comprehensive water demand management strategy developed by a municipality. Such logging is now also being recognised as a cost-effective measure in managing leakage and water use in large industries as well as smaller consumers such as townhouse complexes and shopping centres. With the recent advances in cellular communication technology, the costs associated with real-time logging and the associated internet access have been greatly reduced to the extent that it is now within reach of many new potential users. When considering the use of real-time logging, a new user must carefully consider the available options and select a system that best suits their needs and budget. Each data transmission system has its advantages and disadvantages. Some of the key considerations include:
- cost of the logger
- costs associated with the data transmission (SIM card costs, monthly rental, etc.)
- reliability of the equipment
- power source required for the equipment and batter y life in case of battery powered units
- software requirements for the equipment
- ease of use and ease of programmability of the loggers
- water resistance of the loggers (i.e. IP68 etc.)
- easeful life of the loggers.
Water is becoming a scarce resource throughout all of South Africa and the need to conserve water is being stressed on a daily basis by municipalities and government departments alike. Proper monitoring and control of leakage will become commonplace throughout the country as the technology becomes more cost effective and the price of water rises.